How to Build a Social Media Analytics Dashboard for Automated SEO Reporting and Monthly Content Performance Reports
Estimated reading time: 10 minutes
Key Takeaways
- Centralized Insights consolidate marketing data into a single, intuitive dashboard.
- Automating data refreshes saves significant time and reduces errors.
- Scalable Reporting adapts to diverse platforms and coaching-specific KPIs.
- Monthly performance narratives drive strategic decision-making.
Table of Contents
- Step 1: Define Your KPIs
- Step 2: Choose Your Dashboard Platform
- Step 3: Building the Social Media Analytics Dashboard
- Step 4: Integrating Automated SEO Reporting
- Step 5: Crafting Your Monthly Content Performance Report
- Best Practices and Common Pitfalls
- Next Steps and Resources
- Frequently Asked Questions
Step 1: Define Your KPIs
Start by selecting quantifiable metrics that align with your marketing goals.
- Engagement (likes, comments, shares)
- Reach (impressions, views)
- Follower growth
- Content performance by type
SEO Reporting Metrics
- Organic sessions
- Keyword rankings
- Backlink acquisition
- Click-through rates
- Search Console performance
For Coaches
- Session bookings
- Lead magnet downloads
- Webinar sign-ups
- Consultation calls scheduled
Step 2: Choose Your Dashboard Platform
Google Data Studio (now Looker Studio) offers cost-effective, native integrations and customizable templates. [Source]
- Google Analytics integration [Source]
- Search Console integration [Source]
- Facebook Insights [Source]
- Twitter Analytics, Instagram Insights, LinkedIn Analytics
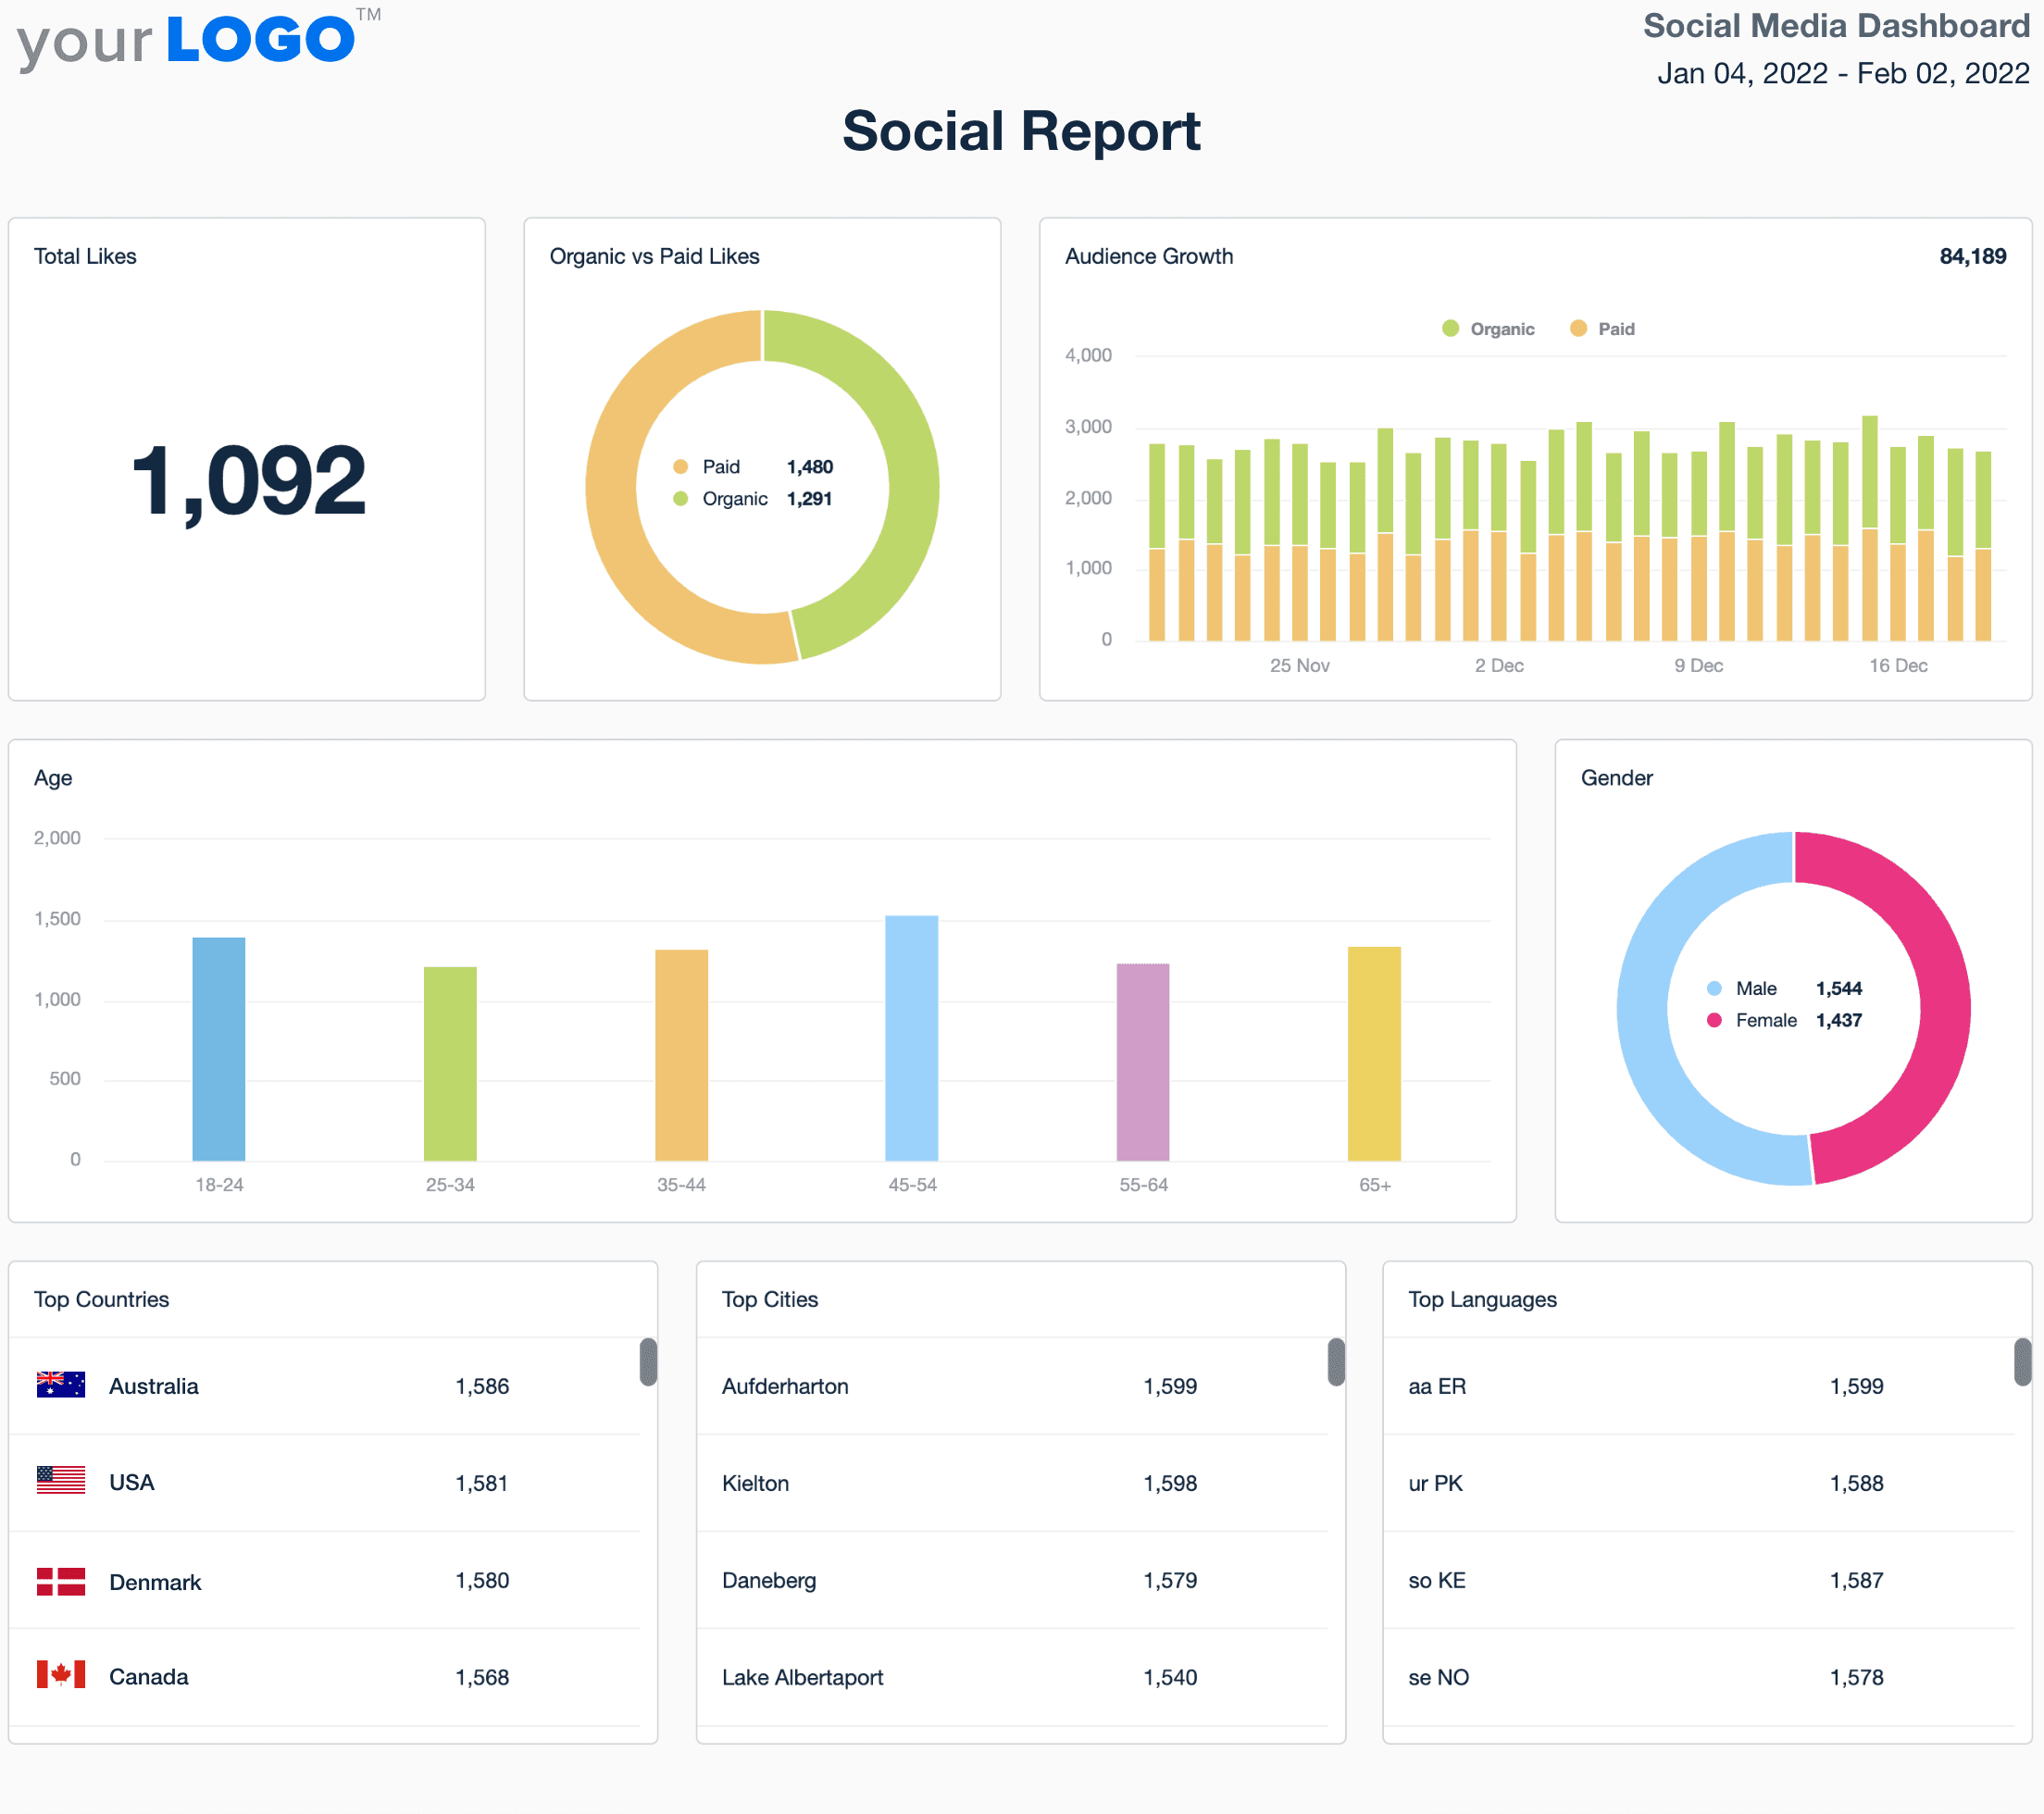
Step 3: Building the Social Media Analytics Dashboard
Connect APIs, then design custom visualizations:
- Trend Analysis: engagement over time, follower growth charts
- Performance Tables: top-performing posts, content type analysis
- Interactive Elements: date range selectors, platform filters
Configure automated data refreshes to ensure real-time accuracy.
Step 4: Integrating Automated SEO Reporting
- Traffic Analysis: organic traffic trends, landing page performance
- Keyword Tracking: position changes, search impression data
- Unified Metrics: combined social shares and rankings
Step 5: Crafting Your Monthly Content Performance Report
- Executive Summary: key metrics overview, top 5 posts
- Automated Distribution: scheduled PDF exports, email delivery
- Performance Narrative: trend analysis, strategic recommendations
Best Practices and Common Pitfalls
- Data Validation: regular connector audits and cross-platform checks.
- Visual Organization: focus on actionable widgets, clean layouts.
- Continuous Improvement: gather feedback; refine KPIs and visuals.
Next Steps and Resources
- Define your core KPIs
- Select and customize templates
- Connect data sources and configure updates
- Test, validate, and share with stakeholders
Frequently Asked Questions
What is a social media analytics dashboard?
A centralized platform that aggregates and visualizes social and SEO performance data to inform strategic decisions.
How do I integrate SEO reporting?
Connect Search Console and Analytics APIs, then create widgets for traffic trends, keyword rankings, and unified metrics.
Which KPIs should coaches track?
Focus on session bookings, lead magnet downloads, webinar sign-ups, and consultation calls to measure coaching-specific performance.
How often should I update the dashboard?
Automate data refreshes daily or in real time to maintain accuracy and provide up-to-date insights without manual intervention.